Know Your Keywords — Math, Advanced
Point 8 — Scatterplots
What do we see?
A scatterplot where a translated or scaled equation has to be calculated.
What do we understand?
Use Desmos for the equation of the line of best fit shown, then transform that equation to get the line for the new data set.
Tips & traps
Stub errors are possible here — apply the transformation to the right variable.
Question 1 of 2
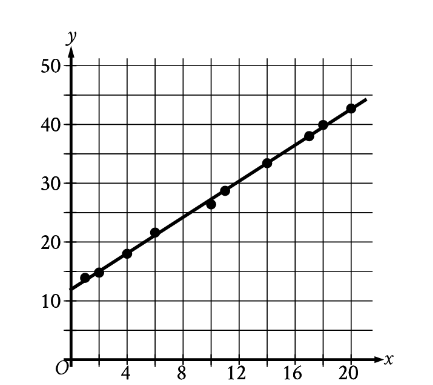
The scatterplot shows the relationship between two variables, x and y, for data set E. A line of best fit is shown. Data set F is created by multiplying the y-coordinate of each data point from data set E by 3.9. Which of the following could be an equation of a line of best fit for data set F?